Data on the screen.
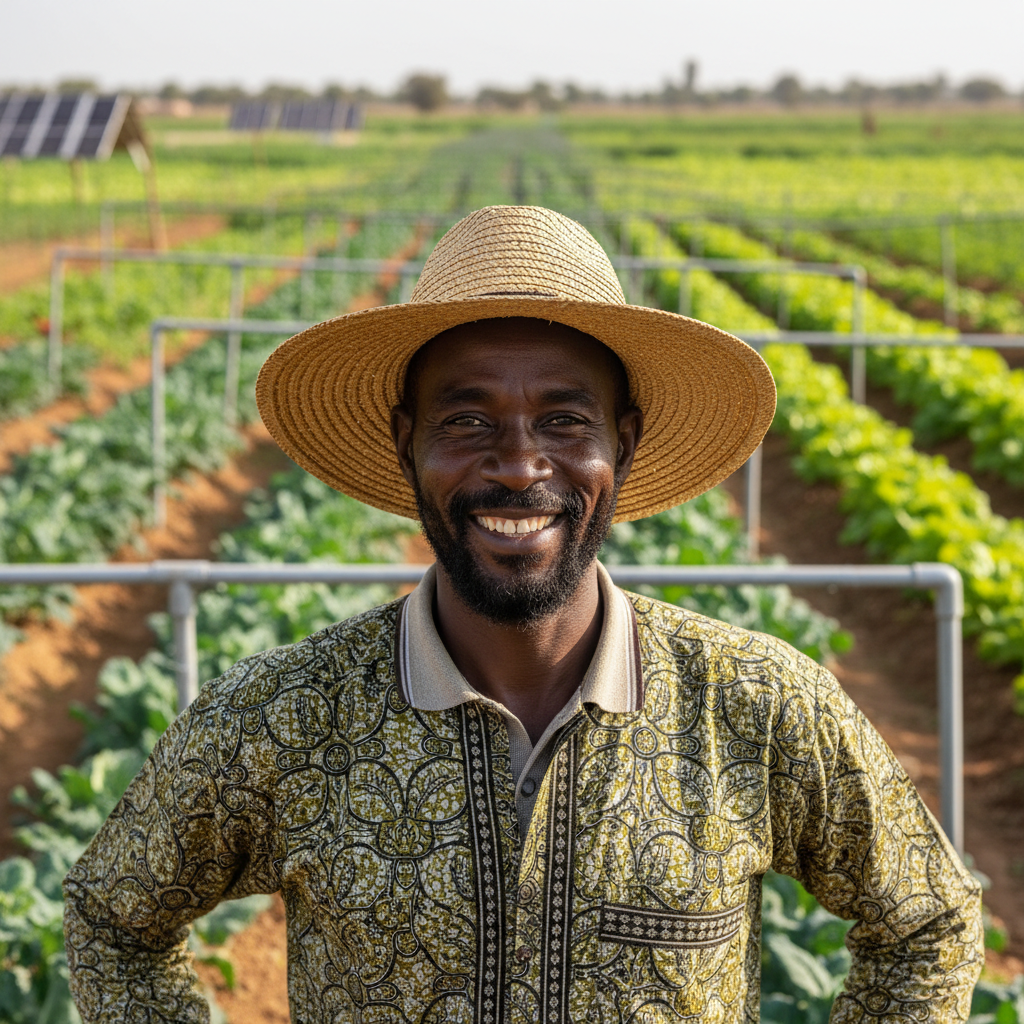
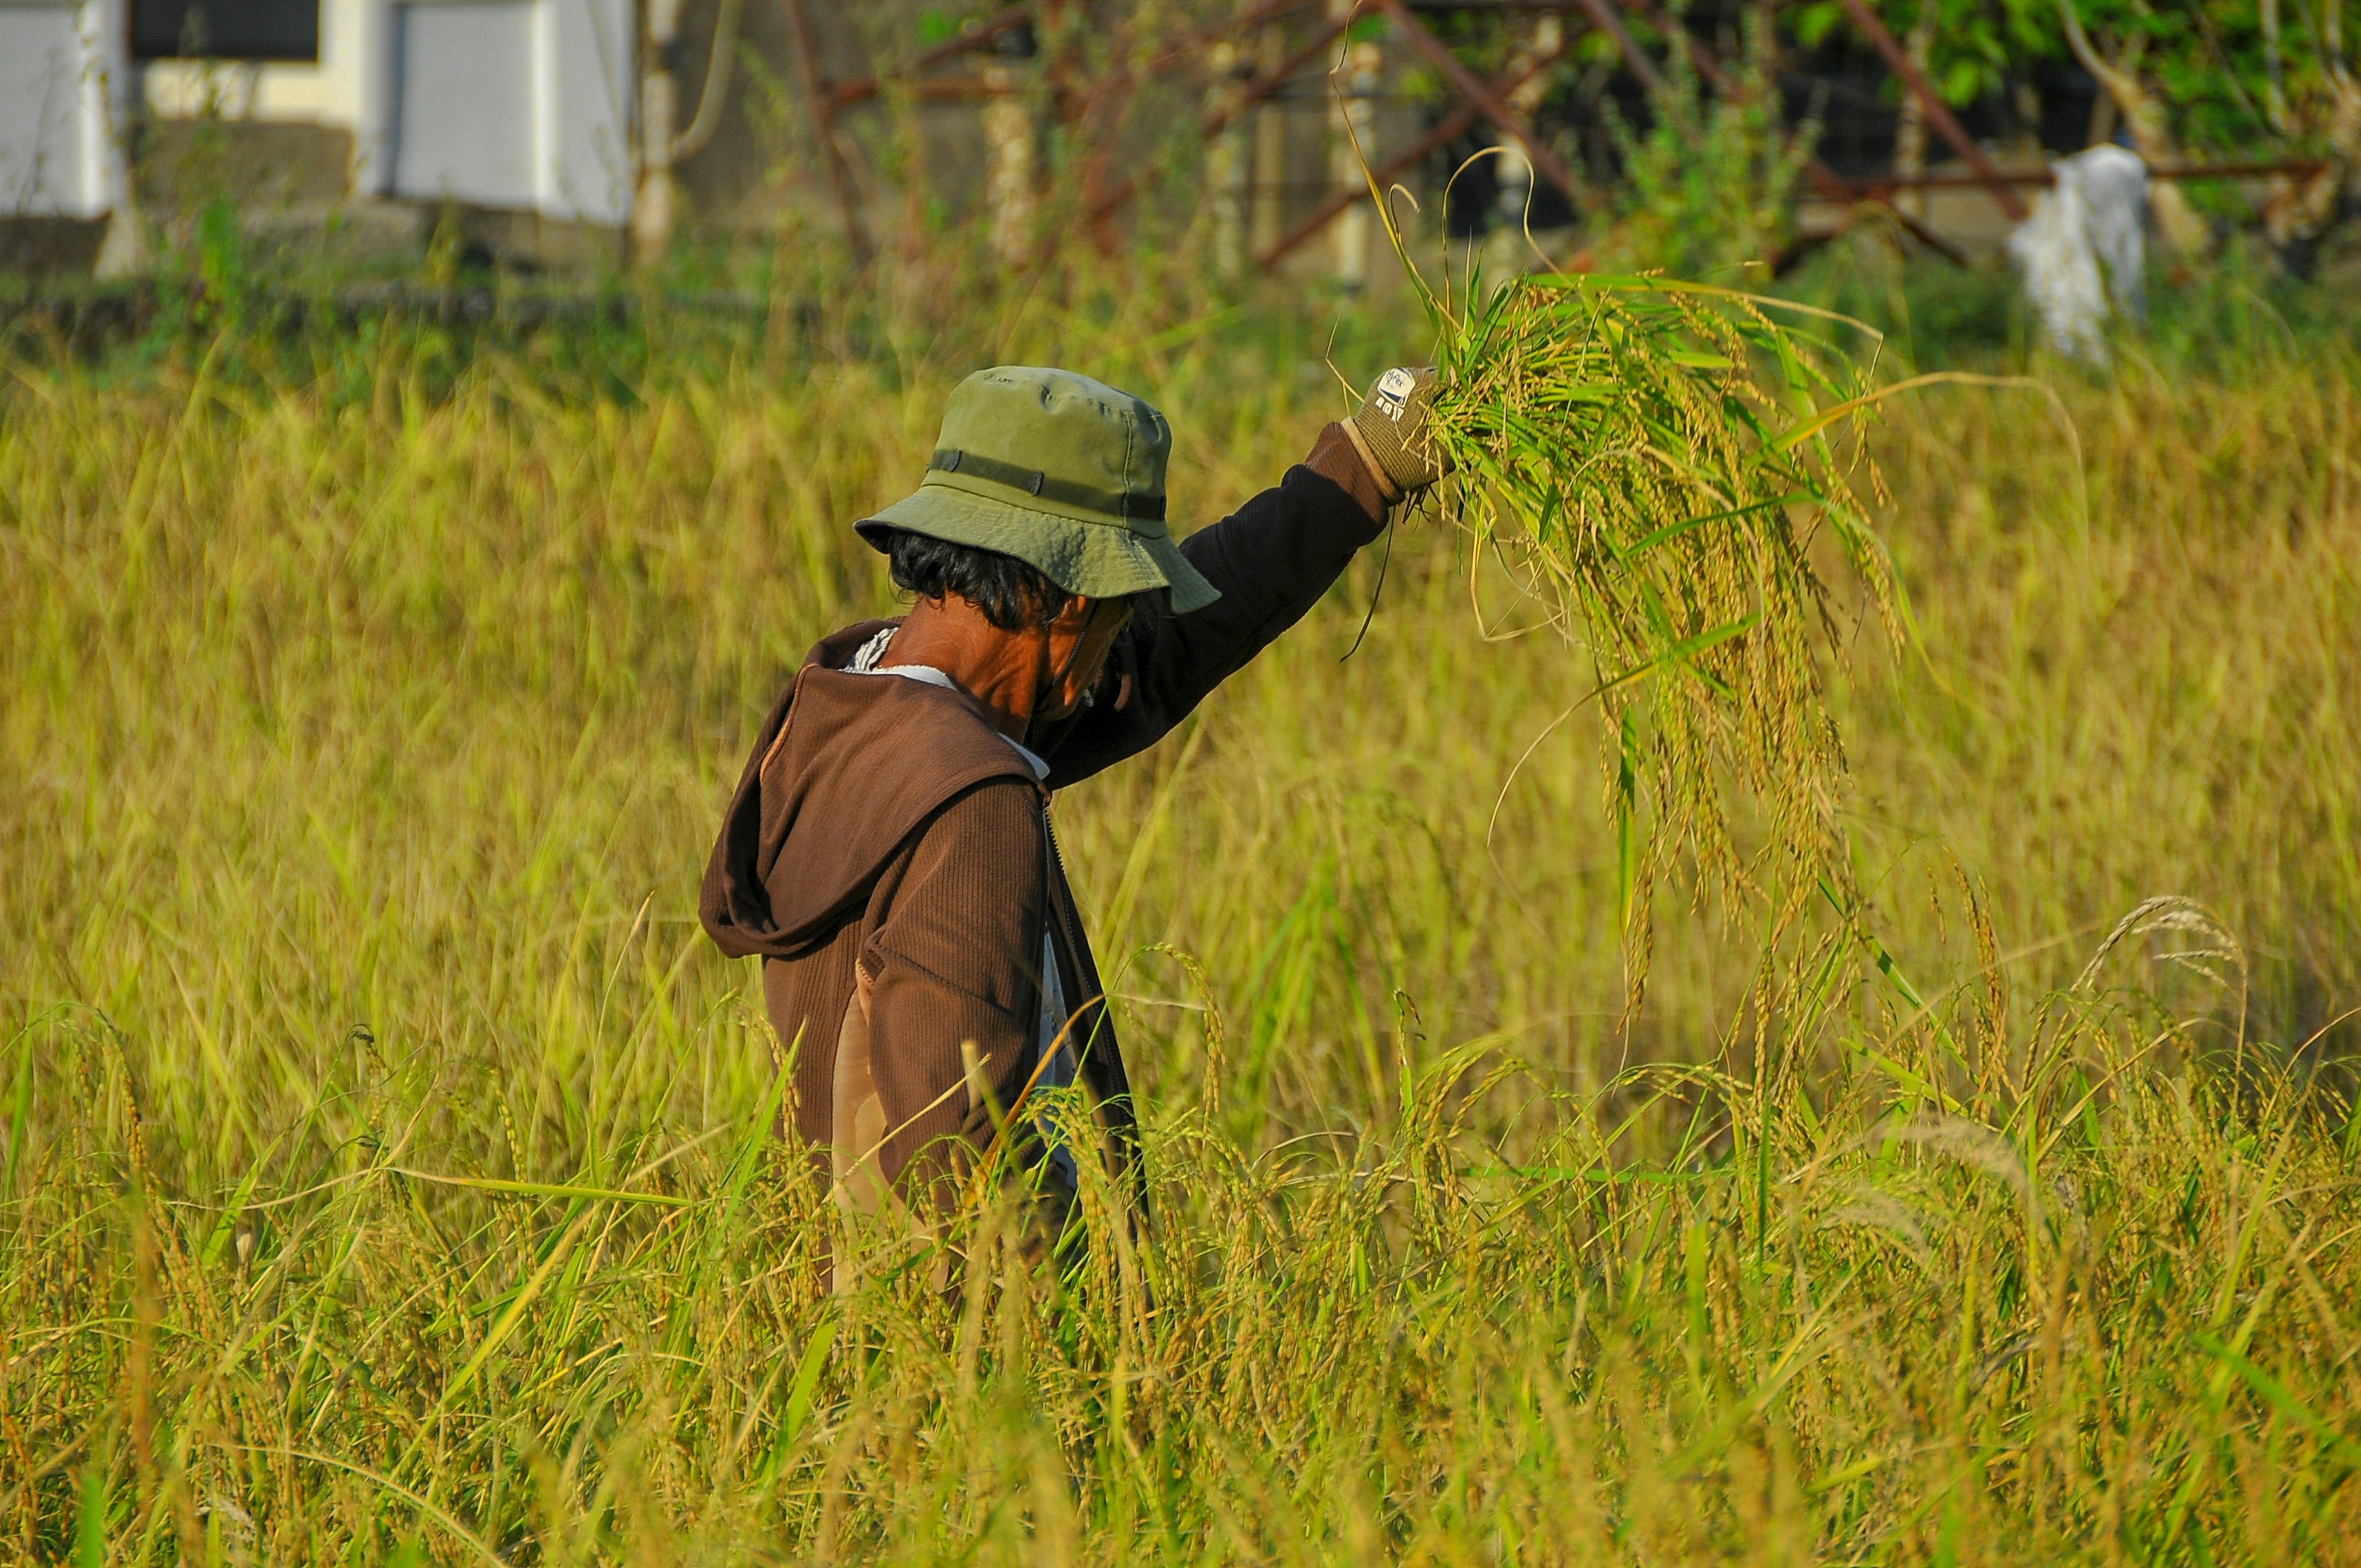
Yield in the field.
Precision agriculture training built for operators who inherit land, not just algorithms. Satellite dashboards, soil labs, and drone workshops — all from a browser tab.
How much yield are you leaving on the field?
Based on 4,200 graduates across 11 countries. Individual results vary by region and practice.
YouTube farming costs more
than you think.
Every season you spend piecing together advice from scattered sources is a season of compounding crop-loss risk, zero certification, and knowledge that doesn't stick past 6 months.
| Comparison | Self-Taught / YouTube | Cultivate Platform |
|---|---|---|
| Time to Field Competency | 18–24 months | 90 days structured |
| Knowledge Retention at 6 Months | ~22% | 74% avg. retention |
| Crop-Loss Risk (Year 1) | High — 15–30% | Reduced to 4–8% |
| Certification Recognition | None / informal | ISO-aligned certificate |
| Seasonal ROI on Training Cost | Negative (trial/error) | 4–9× return avg. |
| Soil Health Monitoring | Visual / guesswork | Live sensor dashboard |
| Peer Network Access | Scattered forums | 4,200+ active grads |
Free to start · No credit card · First module unlocked immediately
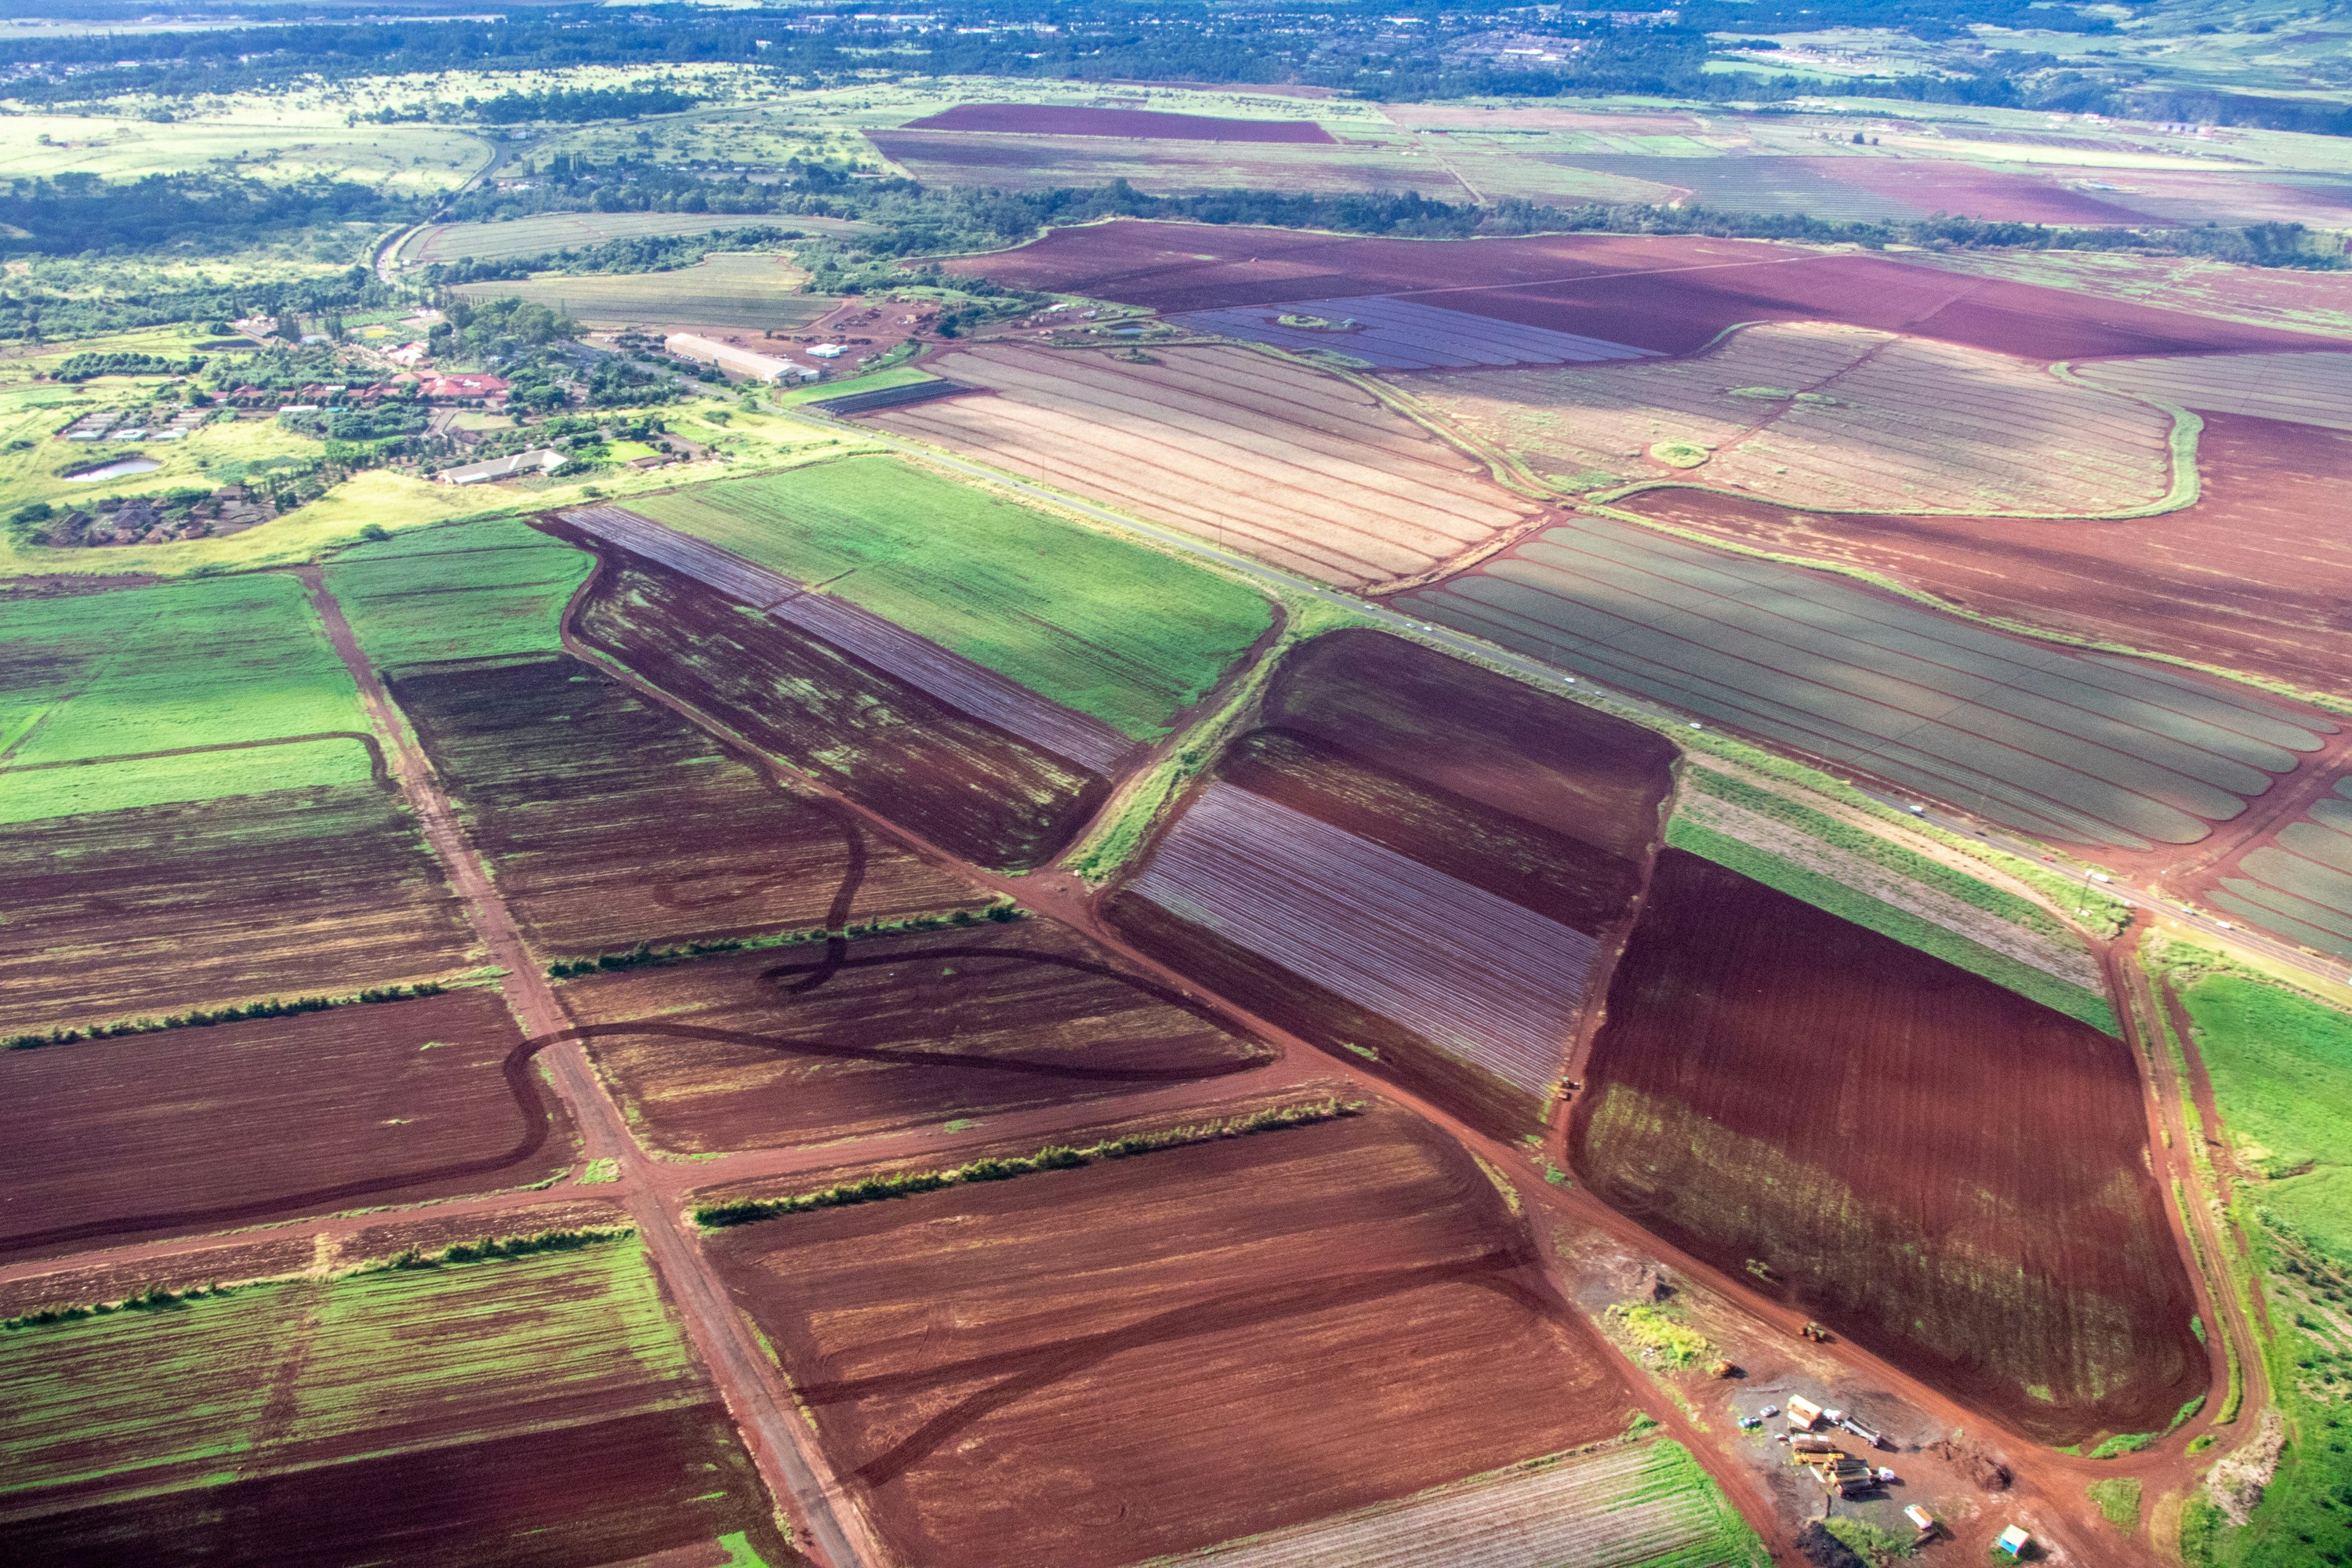
From satellite to soil
to market.
Each module is a live, browser-based lab — not a video lecture. Tilt the cards to preview the dashboard you'll be working in.
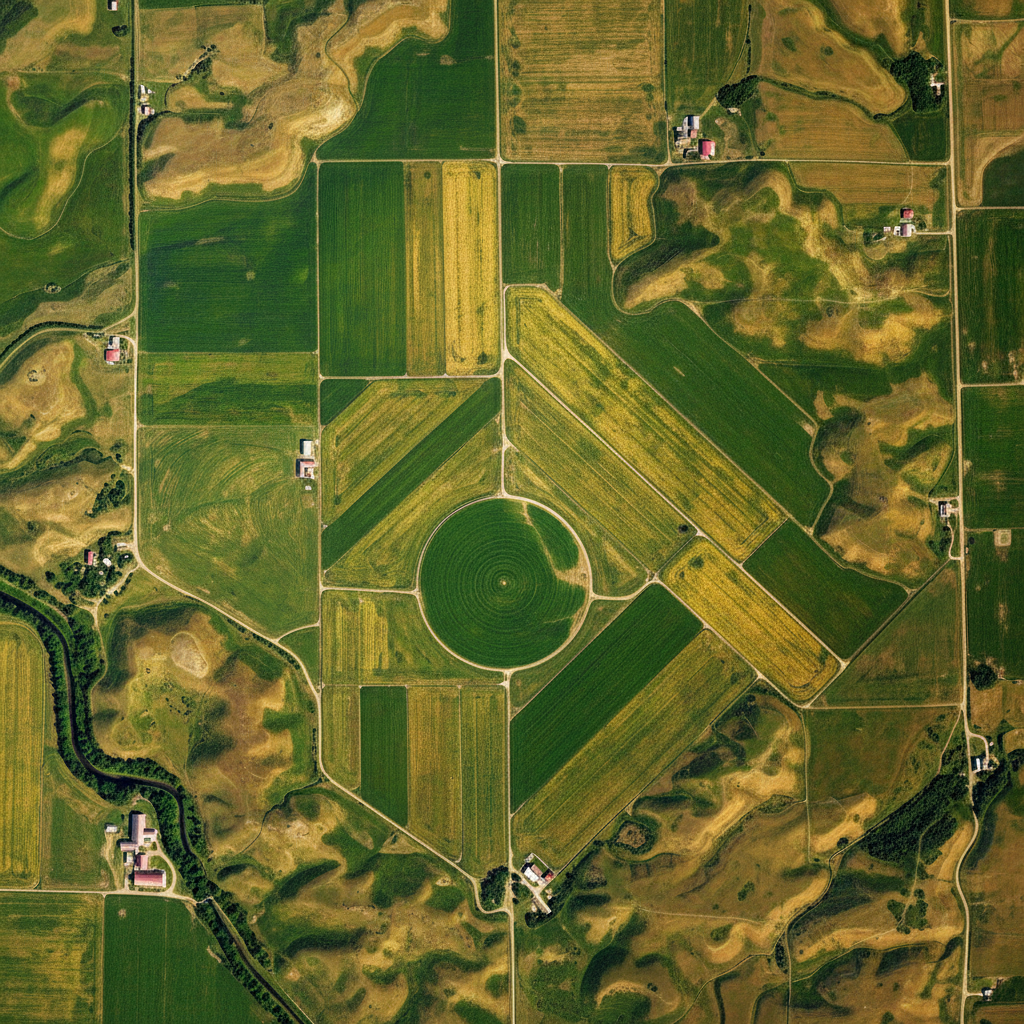
Live Satellite Dashboard
Interpret NDVI, soil-moisture, and crop-stress indices directly from Sentinel-2 imagery — updated every 5 days.
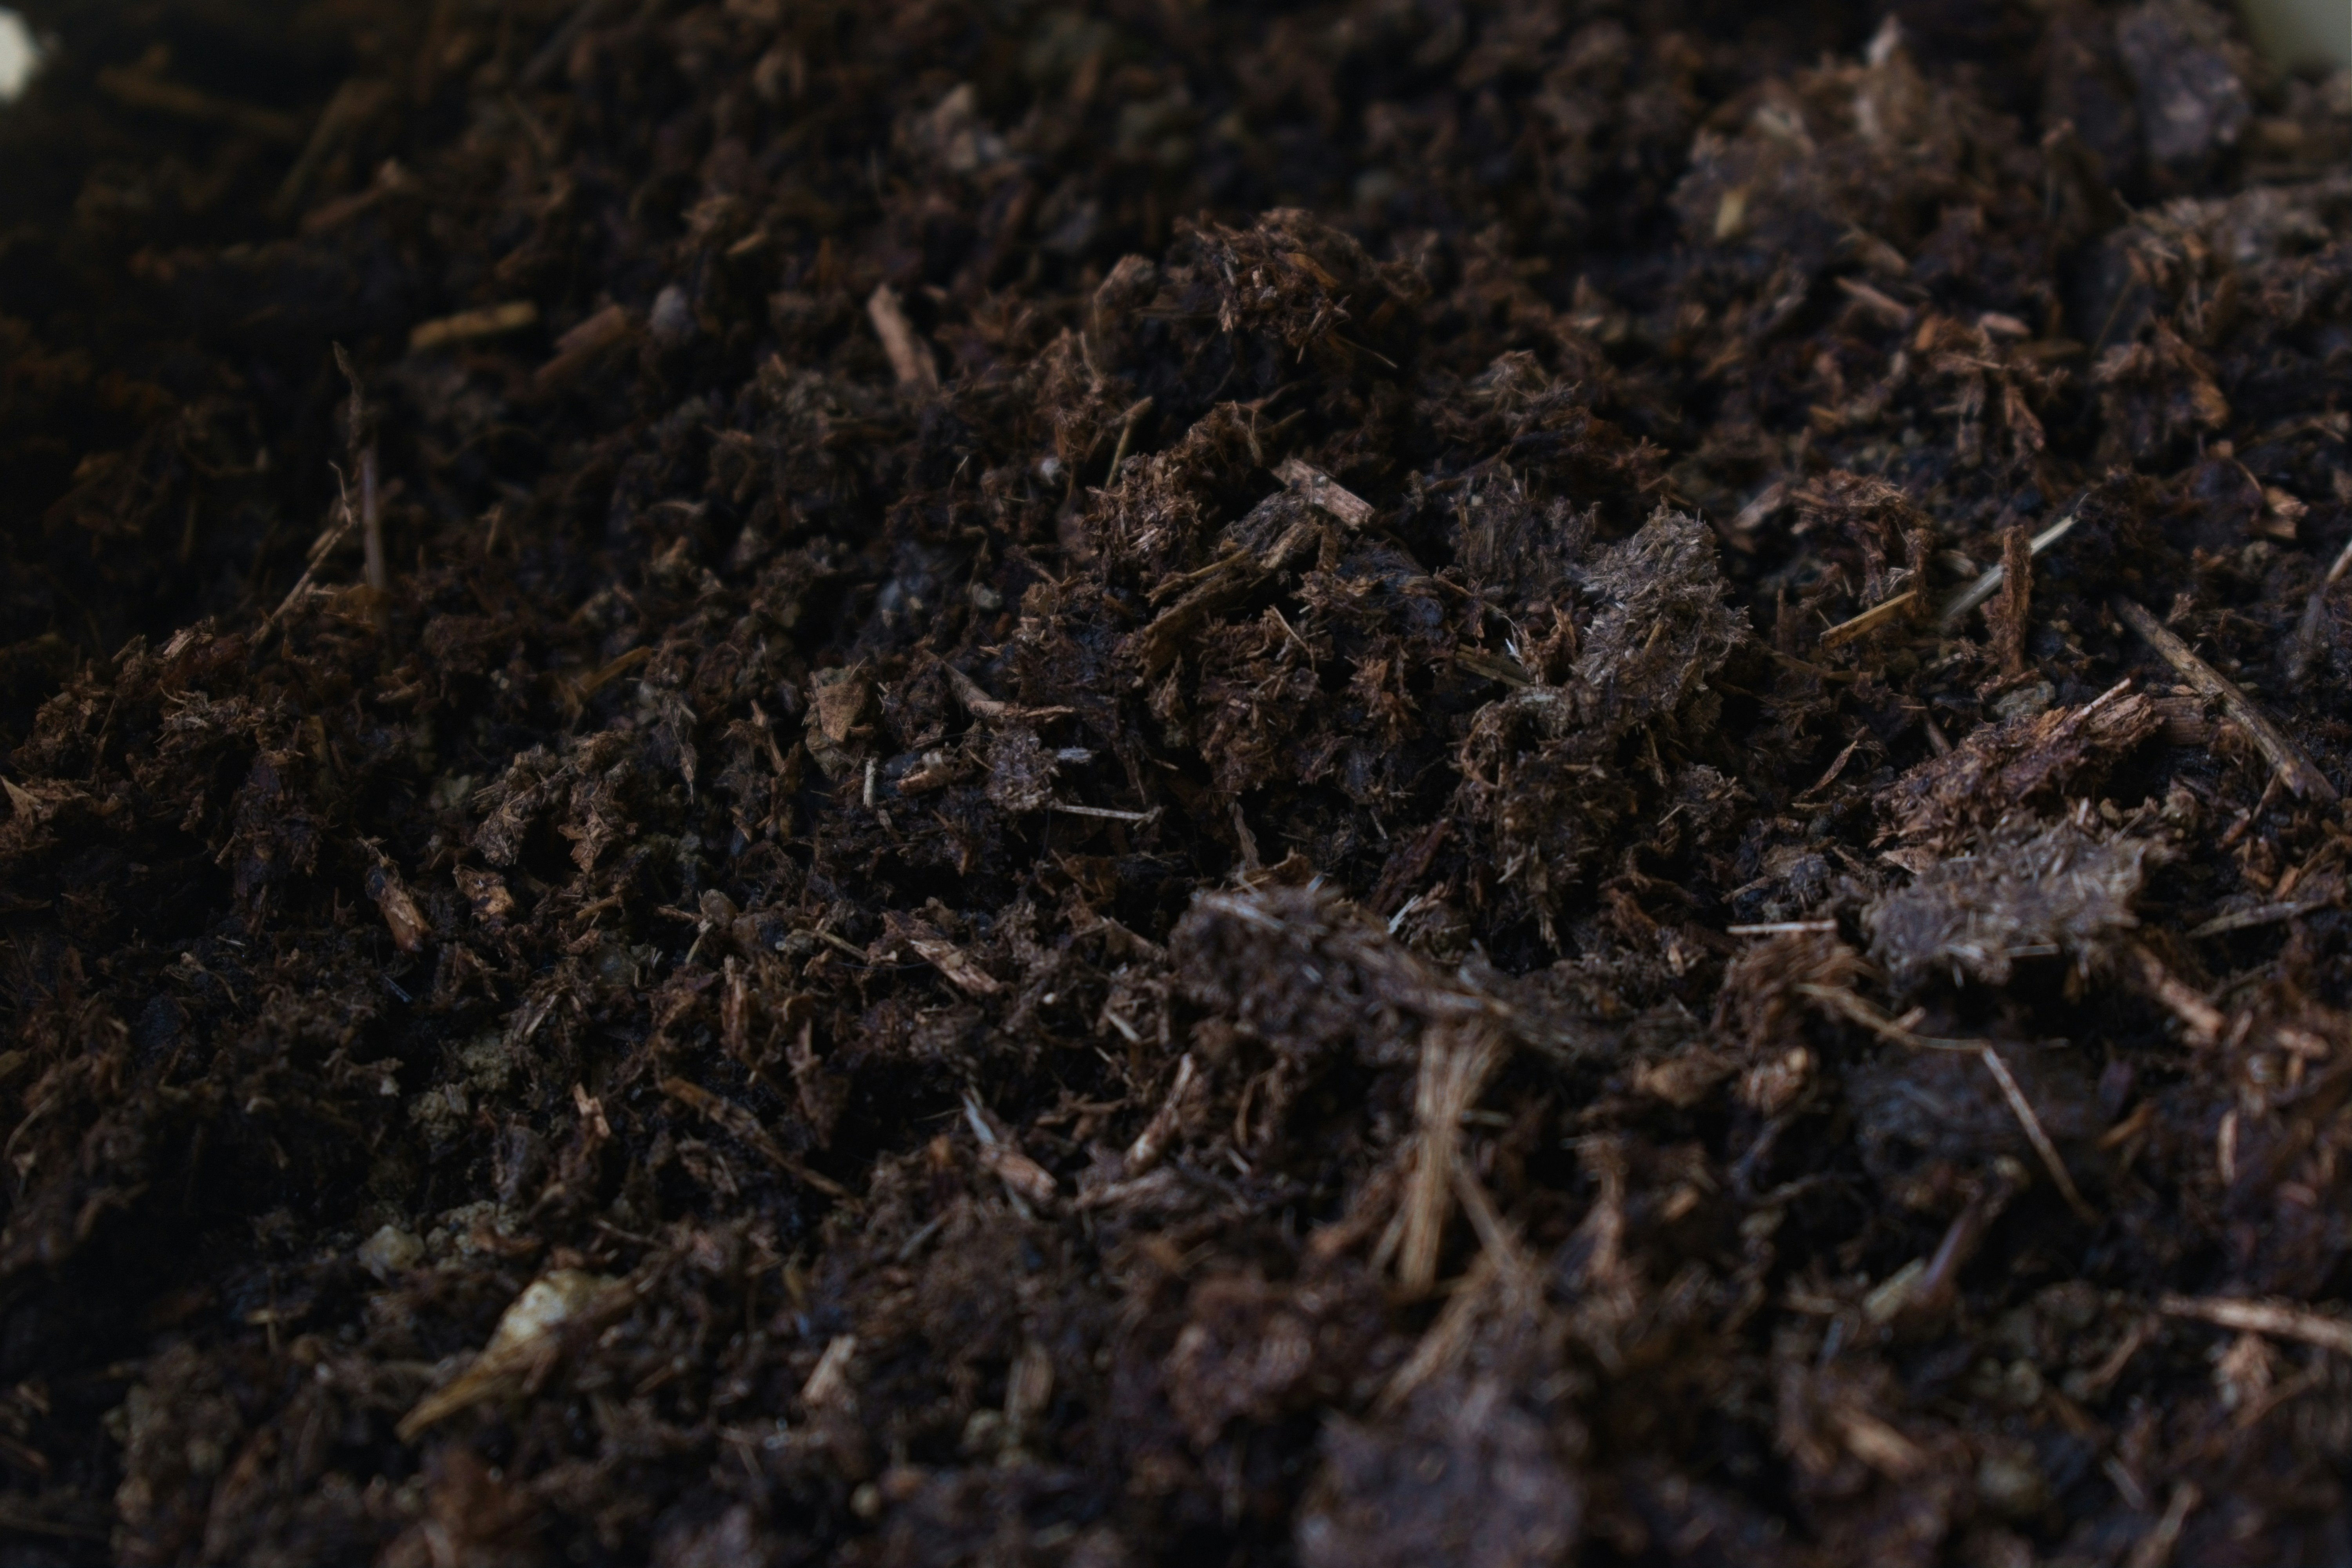
Soil-Chemistry Lab
Map pH, nitrogen, phosphorus, and microbiome health across your field grid. Build amendment plans that last.
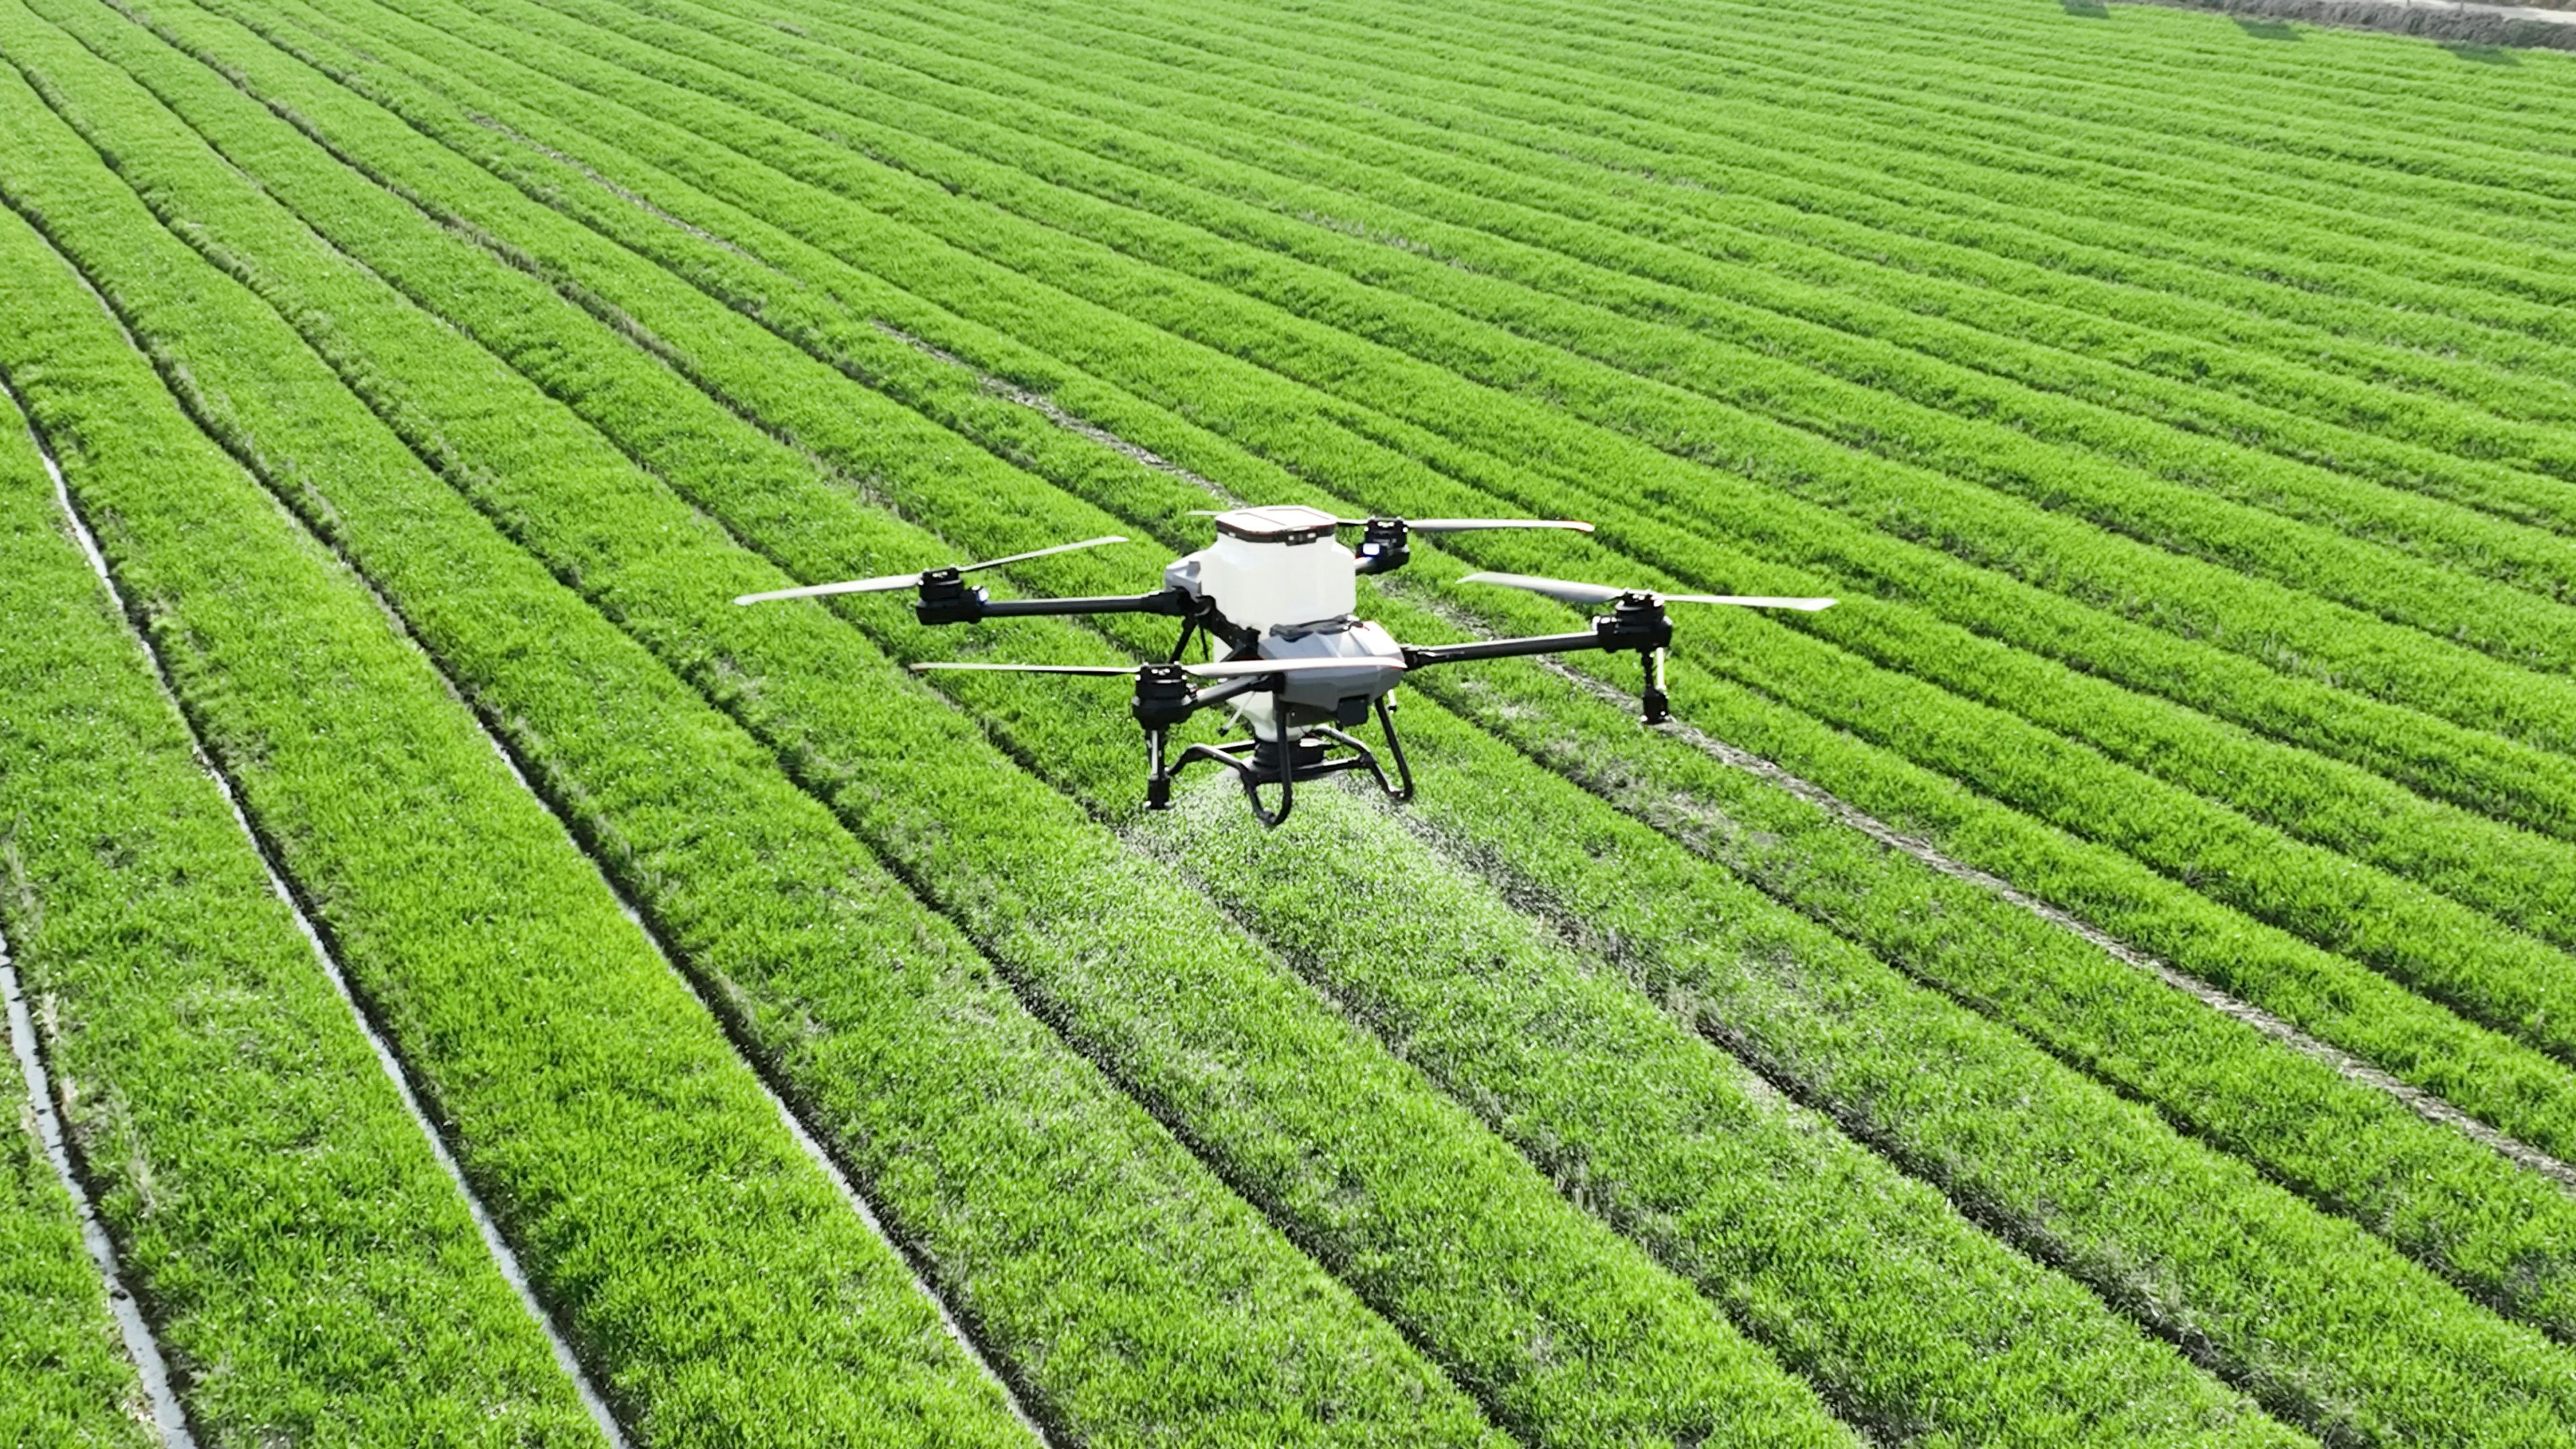
Drone Mapping Workshops
Plan flight paths, process orthomosaic maps, and extract actionable zone prescriptions in under 2 hours.
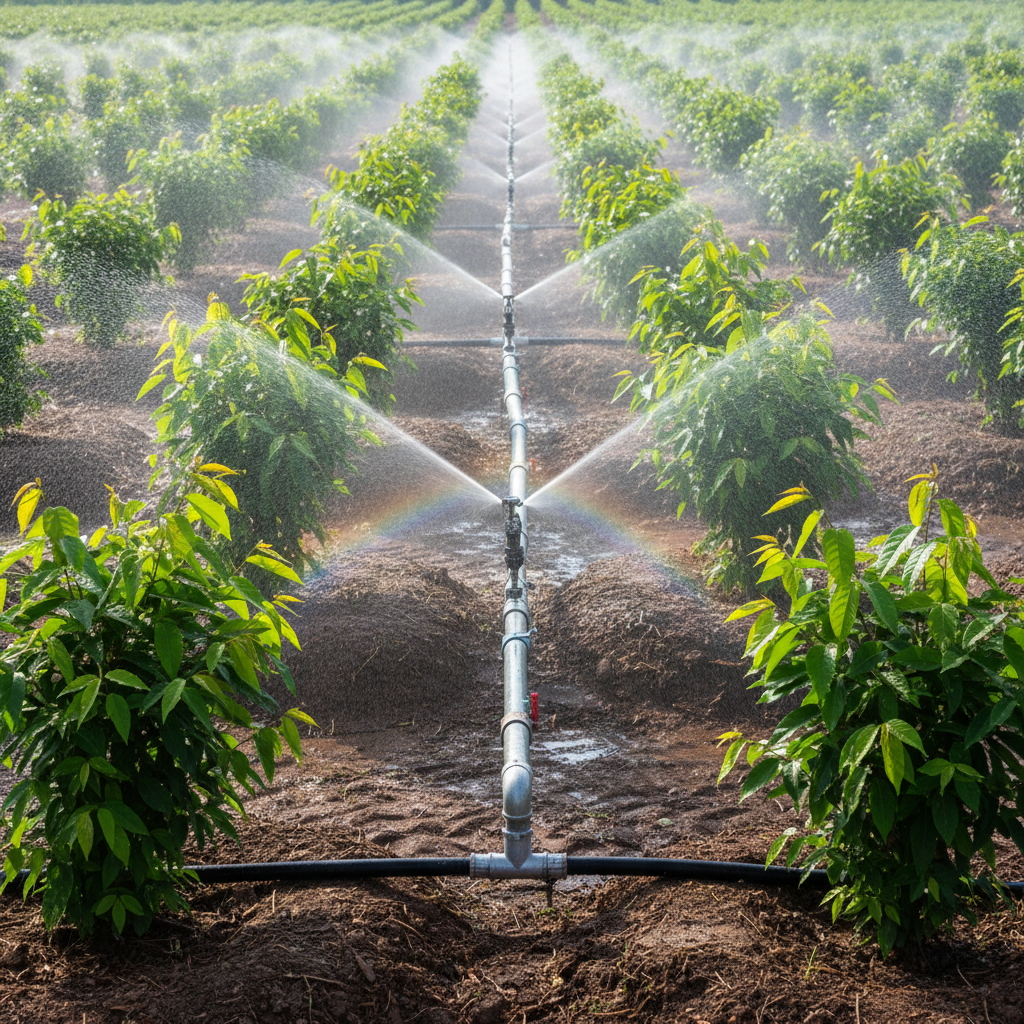
Smart Irrigation Systems
Install sensor networks, set deficit-irrigation triggers, and cut water usage by 30% without yield loss.
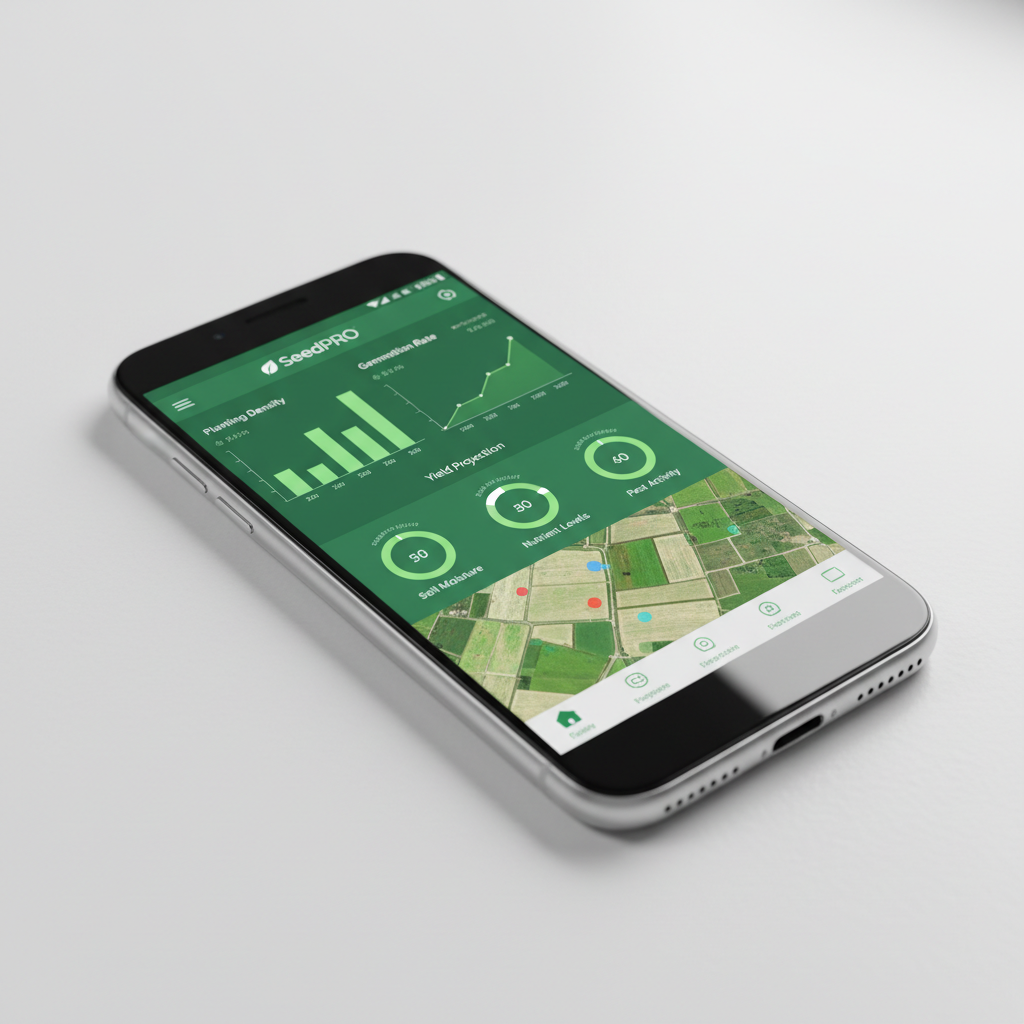
Field Data & Decision Engine
Connect yield monitors, weather APIs, and commodity prices into a single decision dashboard built in the browser.

Cooperative & Market Access
Model cooperative structures, negotiate bulk input pricing, and connect to verified export channels.
"The drone-mapping module alone recovered 18 tonnes I was losing to undetected waterlogging. I paid for the entire course in the first harvest."
Numbers that live
in the field, not the deck.
Outcomes tracked 12 months after graduation across 4,200 operators. Methodology available on request.
"I went from guessing nitrogen rates to running a variable-rate application map. My maize yield jumped from 4.2 t/ha to 6.1 t/ha in one season."
"As a cooperative manager overseeing 12 member farms, the platform gave us a shared language for soil data. Our collective yield is up 31%."
This season will be
different.
You've seen the comparison. You've run the numbers. The only thing between you and a 38% yield increase is the form on the right.
Trusted by operators in